
- Support Knowledge Base
- Back End
- Dashboard
Dashboard
Dashboard
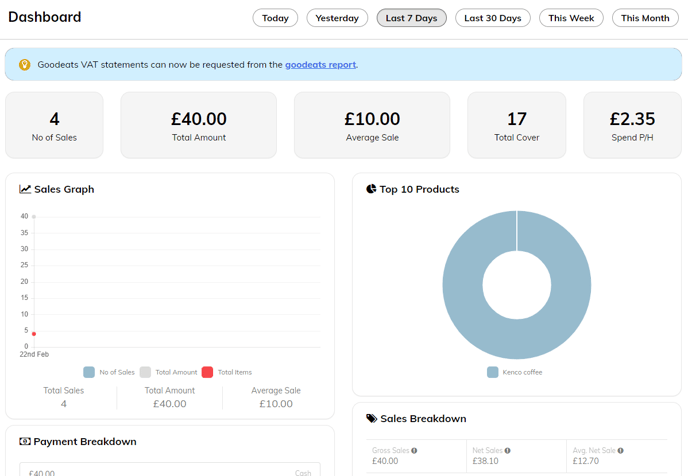
The dashboard shows you at a glance overview of your sales performance. The system displays your total number of sales alongside the total amount sold, to provide you with an immediate summary of your sales history all in one place.
You are able to see a detailed overview of your sales, compiled into a graph on the left -hand side of the page. You can easily filter the data by clicking on the date buttons above the graph, you can view your sales performance anywhere from today, yesterday, last 7 days, etc.
You can also see the top 10 best-selling products on the right-hand side of the page, which are sorted and coloured within a pie chart. Again, you are able to filter the date range simply by clicking the buttons above the chart.
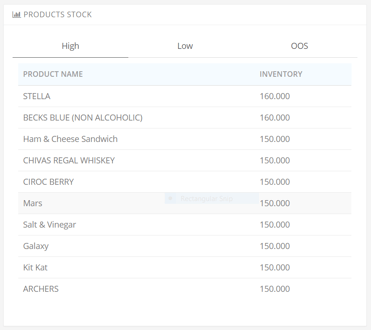
You can get a quick look at how your products are doing in terms of stock, whether they’re high in stock, low in stock or out of stock.

If you'd like to customise your dashboard further, please use this link.